Canadian housing markets set records again in February
Ottawa, ON, March 15, 2021 – Statistics released today by the Canadian Real Estate Association (CREA) show national home sales set another all-time record in February 2021.
Summary:
- National home sales rose 6.6% on a month-over-month (m-o-m) basis in February.
- Actual (not seasonally adjusted) activity was up 39.2% year-over-year (y-o-y).
- The number of newly listed properties rebounded by 15.7% from January to February.
- The MLS® Home Price Index (HPI) jumped 3.3% m-o-m and was up 17.3% y-o-y.
- The actual (not seasonally adjusted) national average sale price posted a 25% y-o-y gain in February.
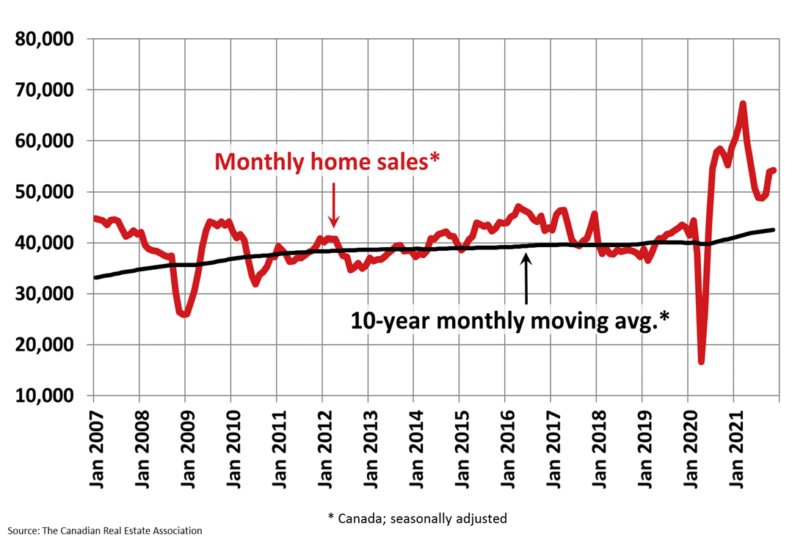
Home sales recorded over Canadian MLS® Systems climbed 6.6% between January and February 2021 to set another new all-time record.
Seasonally adjusted activity was running at an annualized pace of 783,636 units in February. CREA’s revised forecast for 2021 is in the neighbourhood of 700,000 home sales. Strong demand notwithstanding, sales may be hard pressed to maintain current activity levels in the traditionally busier spring months absent a surge of much-needed new supply; although, that could materialize as current COVID restrictions are increasingly eased and the weather starts to improve.
The month-over-month increase in national sales activity from January to February was led by the Greater Toronto Area (GTA) and a number of other Ontario markets, along with Calgary and a number of markets in B.C. These offset a considerable decline in sales in Montreal, where new listings have started off 2021 at lower levels compared to those recorded in the second half of last year.
Actual (not seasonally adjusted) sales activity posted a 39.2% y-o-y gain in February. In line with heightened activity since last summer, it was a new record for the month of February by a considerable margin (over 13,000 transactions). For the eighth straight month, sales activity was up in the vast majority of Canadian housing markets compared to the same month the previous year. Among the eight markets that posted year-over-year sales declines in February, extremely limited supply at the moment is the most likely explanation.
“At this point everyone knows how far the current monthly sales numbers are from historical norms, and that they have been setting record after record for eight months now, so this should not be a surprise like the weak numbers posted last spring were,” stated Costa Poulopoulos, Chair of CREA. "The two big challenges that continue facing Canadian housing markets are the same ones we've been facing for months – COVID-19 and a lack of supply. With luck, potential sellers will feel more comfortable listing their homes in the short-term. As lockdowns continue easing across the country and the spring market begins to ramp up, we will remain vigilant in adhering to all the latest government and health officials’ directives to keep our clients safe. Now as always, REALTORS® remain the best source for information and guidance when negotiating the sale or purchase of a home,” continued Poulopoulos.
“We are right at the start of the first undisturbed (by policy or lockdown) spring housing market in years and we also have the most extreme demand-supply imbalance ever by a large margin. So, the question is, what is going on? I think part of it is demand that built up as a result of regulatory changes in the years leading up to COVID that is playing out now. Part of it is demand that is being pulled forward from the future either in search of a home base to ride out the pandemic, or to lock down a purchase amid rapidly rising prices while securing a record low mortgage rate,” said Shaun Cathcart, CREA’s Senior Economist. “But maybe the biggest factor here is the emergence of existing owners with major equity, prompted by the great shake up that is COVID-19 to pull up stakes and move. First-time buyers, which we have a lot of, are now having to compete with that as well.”
The number of newly listed homes rebounded by 15.7% in February, recovering all the ground lost to the drop recorded in January. With sales-to-new listings ratios historically elevated at the moment, indicating almost everything that becomes available is selling, it was not surprising that many of the markets where new supply bounced back in February were the same markets where sales increased that month.
With the rebound in new supply outpacing the gain in sales in February, the national sales-to-new listings ratio came off the boil slightly to reach 84% compared to the record 91.2% posted in January. That said, the February reading came in as the second-highest on record. The long-term average for the national sales-to-new listings ratio is 54.4%.
Based on a comparison of sales-to-new listings ratio with long-term averages, only about 15% of all local markets were in balanced market territory in February, measured as being within one standard deviation of their long-term average. The other 85% of markets were above long-term norms, in many cases well above. The first two months of 2021 and second half of 2020 have seen record numbers of markets in seller’s market territory. For reference, the pre-COVID record of only around 55% of all markets in seller’s territory was set back at the beginning of 2002.
The number of months of inventory is another important measure of the balance between sales and the supply of listings. It represents how long it would take to liquidate current inventories at the current rate of sales activity.
There were only 1.8 months of inventory on a national basis at the end of February 2021 – the lowest reading on record for this measure. The long-term average for this measure is a little over five months. At the local market level, some 40 Ontario markets were under one month of inventory at the end of February.
The Aggregate Composite MLS® Home Price Index (MLS® HPI) jumped by 3.3% m-o-m in February 2021 – a record-setting increase. Of the 40 markets now tracked by the index, all but one were up on a m-o-m basis.
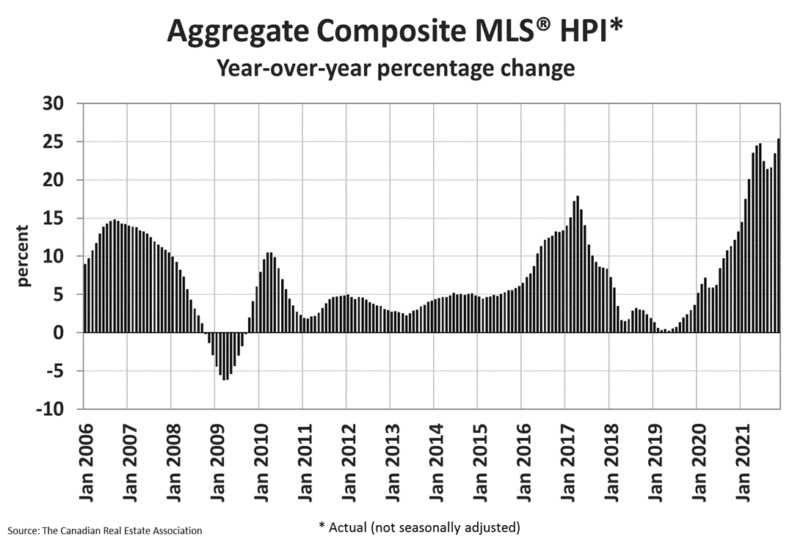
The non-seasonally adjusted Aggregate Composite MLS® HPI was up 17.3% on a y-o-y basis in February – the biggest gain since April 2017 and close to the highest on record.
The largest y-o-y gains – above 35% range – were recorded in the Lakelands region of Ontario cottage country, Tillsonburg District and Woodstock-Ingersoll.
Y-o-y price increases in the 30-35% were seen in Barrie, Niagara, Bancroft and Area, Grey-Bruce Owen Sound, Kawartha Lakes, London & St. Thomas, North Bay, Northumberland Hills, Quinte & District, Simcoe & District and Southern Georgian Bay.
This was followed by y-o-y price gains in the range of 25-30% in Hamilton, Guelph, Cambridge, Brantford, Huron Perth, Kitchener-Waterloo, Peterborough and the Kawarthas and Greater Moncton.
Prices were up in the range from 20-25% compared to last February in Oakville-Milton and Ottawa, 18.8% in Montreal, 16.1% in Chilliwack, in the 10-15% range on Vancouver Island, the Fraser Valley and Okanagan Valley, Winnipeg, the GTA, Mississauga and Quebec, the 5-10% range in Greater Vancouver, Victoria, Regina and Saskatoon, in the 3.5% range in Calgary and Edmonton, and 2.6% in St. John’s.
The MLS® HPI provides the best way to gauge price trends because averages are strongly distorted by changes in the mix of sales activity from one month to the next.
The actual (not seasonally adjusted) national average home price was a record $678,091 in February 2021, up 25% from the same month last year.
The national average price is heavily influenced by sales in Greater Vancouver and the GTA, two of Canada’s most active and expensive housing markets. Excluding these two markets from calculations cuts more than $150,000 from the national average price.
- 30 -
PLEASE NOTE: The information contained in this news release combines both major market and national sales information from MLS® Systems from the previous month.
CREA cautions that average price information can be useful in establishing trends over time, but does not indicate actual prices in centres comprised of widely divergent neighbourhoods or account for price differential between geographic areas. Statistical information contained in this report includes all housing types.
MLS® Systems are co-operative marketing systems used only by Canada’s real estate Boards to ensure maximum exposure of properties listed for sale.
The Canadian Real Estate Association (CREA) is one of Canada’s largest single-industry associations, representing more than 135,000 REALTORS® working through 90 real estate boards and associations.
Further information can be found at http://crea.ca/statistics.
For more information, please contact:
Pierre Leduc, Media Relations
The Canadian Real Estate Association
Tel: 613-237-7111 or 613-884-1460
E-mail: pleduc@crea.ca