August 2020 another record-setting month for many Canadian housing markets
Ottawa, ON, September 15, 2020 – Statistics released today by the Canadian Real Estate Association (CREA) show national home sales and new listings continued to climb in August 2020.
Summary:
- National home sales rose 6.2% on a month-over-month (m-o-m) basis in August.
- Actual (not seasonally adjusted) activity was up 33.5% year-over-year (y-o-y).
- The number of newly listed properties climbed 10.6% from July to August.
- The MLS® Home Price Index (HPI) rose 1.7% m-o-m and was up 9.4% y-o-y.
- The actual (not seasonally adjusted) national average sale price posted an 18.5% y-o-y gain in August.
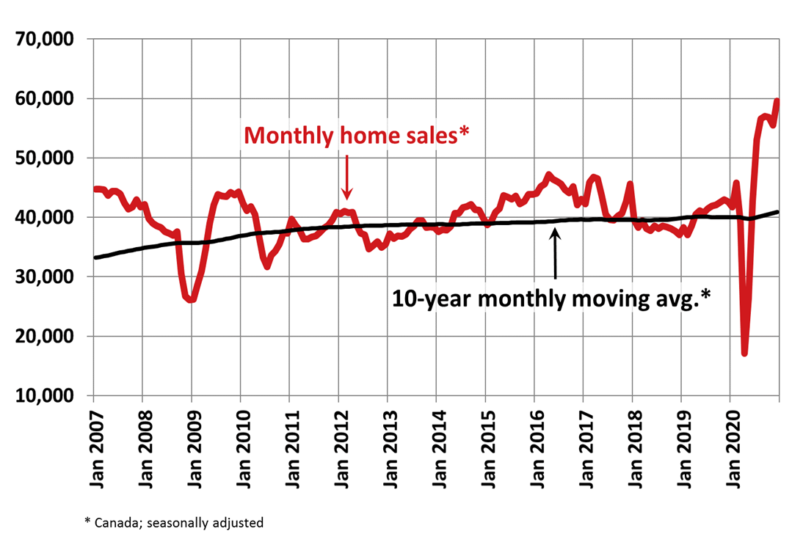
Home sales recorded over Canadian MLS® Systems increased a further 6.2% in August 2020, raising them to another new all-time monthly record.Unlike the previous two months in which activity was up right across the country, sales in August were up in about 60% of local markets. Gains were led by the Greater Toronto Area (GTA) and British Columbia’s Lower Mainland. With ongoing supply shortages in so many parts of Canada, it is interesting to note that the GTA and Lower Mainland also saw a considerable amount of new supply become available in August.
Actual (not seasonally adjusted) sales activity posted a 33.5% y-o-y gain in August. It was a new record for the month of August, and the sixth-highest monthly sales figure of any month on record. Transactions were up compared to last August in almost all Canadian housing markets.
So far this year, some 341,463 homes have traded hands over Canadian MLS® Systems, up 0.8% from the first eight months of 2019.
“It has been a record-setting summer in many housing markets across Canada as REALTORS® and their clients play catch up following the loss of so much of the 2020 spring market,” stated Costa Poulopoulos, Chair of CREA. "Many markets dealing with inventory shortages have been seeing fierce competition among buyers this summer; although, that was something that had been anticipated for 2020 prior to COVID-19. It really does seem that the spring market shifted into the summer. As conditions evolve into fall, we continue to make sure clients stay safe by complying with government and health officials’ directives and advice, including using technology to show properties virtually and to complete required forms and contracts. Now as always, REALTORS® remain the best source for information and guidance when negotiating the sale or purchase of a home,” continued Poulopoulos.
“It will come as a surprise to many that as of the end of August, home sales in 2020 had fully caught up to where we were at that time last year; however, that is somewhat of a low bar as the first half of 2019 wasn’t really anything to write home about,” said Shaun Cathcart, CREA’s Senior Economist. “A more useful comparison would be to ask where are we now versus where we thought we’d be before anyone had ever heard of COVID-19, and on that score there is still a lot of catching up to do. Despite some record monthly highs and lows this year, with eight months now in the books and activity showing signs of moderating in September, 2020 is looking like it will go down as a fairly middling year overall – weaker than in a non-COVID world but quite a bit better than we would have given it back in April.”
The number of newly listed homes posted a further 10.6% gain in August compared to July.
New supply was up in close to three-quarters of local markets, led by gains in the Lower Mainland, GTA and Ottawa.
With the August increase in new supply outpacing the rise in sales for the first time since the rebound began in May, the national sales-to-new listings ratio eased to 69.4% in August compared to 72.3% posted in July. That said, it was still among the highest levels on record for this measure.
Based on a comparison of sales-to-new listings ratio with long-term averages, only about a third of all local markets were in balanced market territory, measured as being within one standard deviation of their long-term average. The other two-thirds of markets were above long-term norms, in many cases well above.
The number of months of inventory is another important measure of the balance between sales and the supply of listings. It represents how long it would take to liquidate current inventories at the current rate of sales activity.
There were just 2.6 months of inventory on a national basis at the end of August 2020 – the lowest reading on record for this measure. At the local market level, a number of Ontario markets are now into weeks of inventory rather than months.
The Aggregate Composite MLS® Home Price Index (MLS® HPI) rose by 1.7% m-o-m in August 2020. Of the 21 markets currently tracked by the index, m-o-m gains were posted everywhere but Victoria and elsewhere on Vancouver Island.
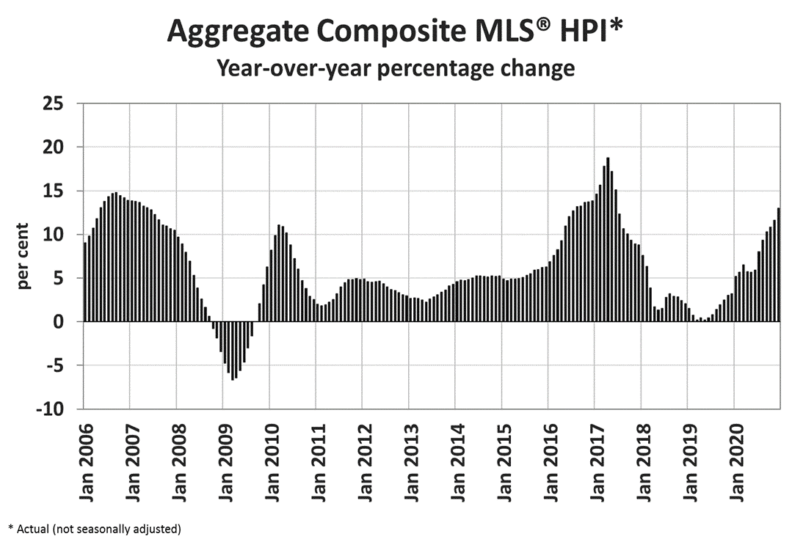
The non-seasonally adjusted Aggregate Composite MLS® HPI was up 9.4% on a y-o-y basis in August – the biggest gain since late 2017.The largest y-o-y gains were recorded in Ottawa (+19.9%) and Montreal (+16.4%), followed by increases in the 10% - 15% range in the GTA and surrounding Greater Golden Horseshoe markets. Moncton prices were also up in that range in August.
Prices were fairly flat on a y-o-y basis in Calgary, Edmonton and St. John’s, while climbing in the 3.5% - 5.5% range across B.C.The MLS® HPI provides the best way to gauge price trends because averages are strongly distorted by changes in the mix of sales activity from one month to the next.The actual (not seasonally adjusted) national average home price set another record in August 2020 at more than $586,000, up 18.5% from the same month last year.The national average price is heavily influenced by sales in Greater Vancouver and the GTA, two of Canada’s most active and expensive housing markets. Excluding these two markets from calculations cuts around $122,000 from the national average price. The extent to which sales continue to fluctuate in these two markets relative to others could have further compositional effects on the national average price going forward, both up and down.
- 30 -
PLEASE NOTE: The information contained in this news release combines both major market and national sales information from MLS® Systems from the previous month.CREA cautions that average price information can be useful in establishing trends over time, but does not indicate actual prices in centres comprised of widely divergent neighbourhoods or account for price differential between geographic areas. Statistical information contained in this report includes all housing types.MLS® Systems are co-operative marketing systems used only by Canada’s real estate Boards to ensure maximum exposure of properties listed for sale.The Canadian Real Estate Association (CREA) is one of Canada’s largest single-industry associations, representing more than 130,000 REALTORS® working through 90 real estate boards and associations.Further information can be found at http://crea.ca/statistics.
For more information, please contact:
Pierre Leduc, Media Relations
The Canadian Real Estate Association
Tel: 613-237-7111 or 613-884-1460
E-mail: pleduc@crea.ca