Housing market moderates in April compared to March
Ottawa, ON, May 17, 2021 – Statistics released today by the Canadian Real Estate Association (CREA) show national home sales were down from March to April 2021.
Summary:
- National home sales declined by 12.5% on a month-over-month basis in April.
- Actual (not seasonally adjusted) activity was up 256% year-over-year.
- The number of newly listed properties fell back by 5.4% from March to April.
- The MLS® Home Price Index (HPI) rose 2.4% month-over-month and was up 23.1% year-over-year.
- The actual (not seasonally adjusted) national average sale price posted a 41.9% year-over-year gain in April.
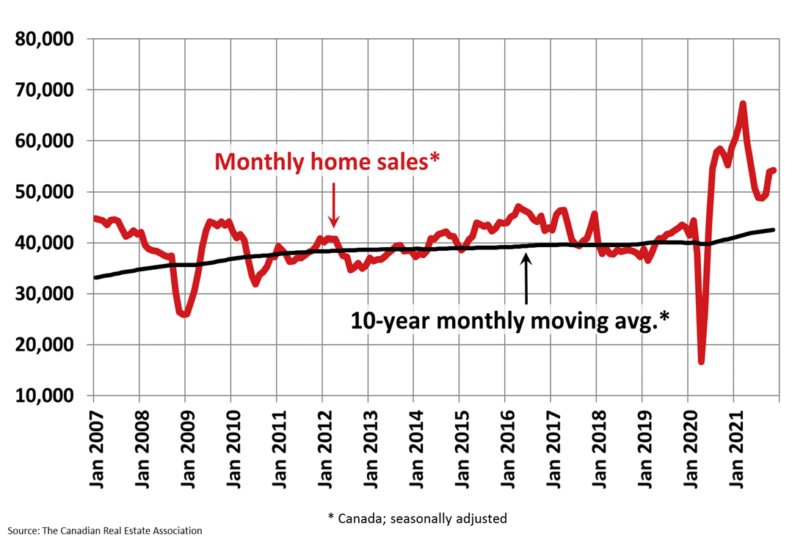
Home sales recorded over Canadian MLS® Systems fell by 12.5% in April 2021 compared to the highest level ever recorded in March.
Month-over-month declines in sales activity were observed in close to 85% of all local markets, including virtually all of B.C. and Ontario.
In contrast, actual (not seasonally adjusted) sales activity posted a 256% year-over-year gain in April, reflecting the chasm between the best April ever in 2021 and the worst ever last year.
“While housing markets across Canada remain very active, there is growing evidence that some of the extreme imbalances of the last year are beginning to unwind, which is what everyone wants to see happen,” stated Cliff Stevenson, Chair of CREA. "That said, the slowdown in sales activity between March and April was at a time that COVID cases, including very concerning variants, hit their highest levels ever and many jurisdictions enacted fresh lockdowns, making it harder to get a clear read on the underlying levels of demand and supply. 2021 may be another year where some of the spring market gets pushed into the summer by COVID-19. As always, your best bet is to consult with your local REALTOR® for the best information and guidance about buying or selling a home this year,” continued Stevenson.
“Home sales were up by more than 250% on a year-over-year basis in April and the average price of those sales was up 42% – the biggest gains ever – which of course means that they were both down, from last month anyway,” said Shaun Cathcart, CREA’s Senior Economist. “Facetiousness aside, what we’re seeing is something known as the ‘base effect,’ which is the impact on statistics that results from the nature of the point of reference. In the case of the April 2021 housing numbers, the year-over-year is a comparison to the worst numbers ever published in April of last year, while the month-over-month relationship is to the strongest numbers ever published in March 2021. The result is that a relatively more ‘reasonable’ set of numbers in April 2021 looks both way up or way down depending on what crazy part of the last year you compare them to, but the correct interpretation of those big numbers is that the April housing numbers came in somewhere in between those extremes, which is a good thing. While we still have a ways to go, measures of market balance have finally turned a corner and monthly price growth has decelerated. I believe we’ve all wanted to see the temperature turned down on this market after the last year and it looks as though that is finally happening.”
The number of newly listed homes declined by 5.4% in April compared to March. In a market with historically low inventory, where sales activity depends on a steady supply of new listings each month, the synchronous gains in new supply and sales in March followed by synchronous declines in April suggest the slowdown in sales may be partially about availability of listings as opposed to only a demand story. New listings were down in 70% of all local markets in April.
The national sales-to-new listings ratio eased back to 75.2% in April compared to a peak level of 90.6% back in January. That said, the long-term average for the national sales-to-new listings ratio is 54.5%, so it is currently still high historically. The good news is that it is moving in the right direction.
Based on a comparison of sales-to-new listings ratio with long-term averages, only about a quarter of all local markets were in balanced market territory in April, measured as being within one standard deviation of their long-term average. The other three-quarters of markets were above long-term norms, in many cases well above.
The number of months of inventory is another important measure of the balance between sales and the supply of listings. It represents how long it would take to liquidate current inventories at the current rate of sales activity.
There were 2 months of inventory on a national basis at the end of April 2021, up from a record-low 1.7 months in March but still well below the long-term average for this measure of a little more than 5 months.
The Aggregate Composite MLS® Home Price Index (MLS® HPI) climbed by 2.4% month-over-month in April 2021 – a historically strong gain but less than in February and March. Most of the recent deceleration in month-over-month price growth has come from the single-family space compared to the more affordable townhome and apartment segments.
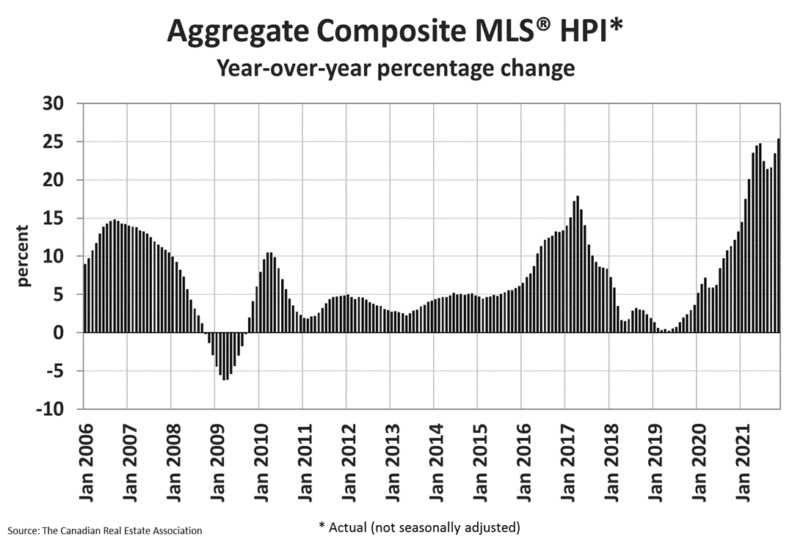
The non-seasonally adjusted Aggregate Composite MLS® HPI was up 23.1% on a year-over-year basis in April. Based on data back to 2005, this was a record year-overyear increase.
The largest year-over-year gains continue to be posted across Ontario (around 20-50%), followed by markets in B.C., Quebec and New Brunswick (around 10-30%), and lastly by gains in the Prairie provinces and Newfoundland and Labrador (around 5-15%).
The MLS® HPI provides the best way to gauge price trends because averages are strongly distorted by changes in the mix of sales activity from one month to the next.
The actual (not seasonally adjusted) national average home price was a little under $696,000 in April 2021, up 41.9% from the same month last year. That said, it is important to remember that the national average price dropped by 10% month-over-month last April as the higher-end of every market effectively shut down for a couple of months. That will serve to stretch these year-over-year comparisons over and above what is actually happening to prices until around June.
The national average price is also heavily influenced by sales in Greater Vancouver and the GTA, two of Canada’s most active and expensive housing markets. Excluding these two markets from calculations cuts more than $144,000 from the national average price.
- 30 -
PLEASE NOTE: The information contained in this news release combines both major market and national sales information from MLS® Systems from the previous month.
CREA cautions that average price information can be useful in establishing trends over time, but does not indicate actual prices in centres comprised of widely divergent neighbourhoods or account for price differential between geographic areas. Statistical information contained in this report includes all housing types.
MLS® Systems are co-operative marketing systems used only by Canada’s real estate Boards to ensure maximum exposure of properties listed for sale.
The Canadian Real Estate Association (CREA) is one of Canada’s largest single-industry associations, representing more than 135,000 REALTORS® working through 78 real estate boards and associations.
Further information can be found at http://crea.ca/statistics.
For more information, please contact:
Pierre Leduc, Media Relations
The Canadian Real Estate Association
Tel: 613-237-7111 or 613-884-1460
E-mail: pleduc@crea.ca